Introduction / Case Study
If you've ever imported the management pack from SolarWinds you quickly learned how to completely kill your SCOM management servers! IMHO the pack is not flexible enough for my needs so I decided why not create my own?
I am in the infant stages of this pack and welcome community involvement and feedback. I am currently working with my SolarWinds administrators to properly target key areas of the SolarWinds alerting data so that I can display network health in LiveMaps and in SCOM.
Overview
I decided early on that I didn't want to duplicate the monitoring that SolarWinds is already doing. I don't think polling my network devices AGAIN from SCOM is going to help anyone in the long run. Why not just go after the SolarWinds data that exists within the SolarWinds database and harvest out the things that matter? Novel idea... I think. This way I leave the control to the network trolls on what alerts, why it alerts and when it alerts. I can then take my management pack and inject more intelligence into it where SolarWinds falls short. I want to filter out the noise and that is just what I am going to do.At a very high level I am using PowerShell probes to go after the database for both my discoveries and my monitor data. I can decide how I want to display that in SCOM and on LiveMaps by coding in the relationships into the pack. Currently, my health model consists of:
A rollup that contains Interfaces, Nodes and Sites... This class structure allows interface and node rollups to affect Sites on my maps... You will quickly see that Interfaces and Nodes can be noisy and make your Sites always unhealthy... A good perspective for the LiveMaps service tab for infrastructure, but not necessarily affecting the end user.
Sites
|
Nodes
|
Interfaces
I also built a duplicate class structure that just includes sites and if they are up and down according to SolarWinds. In this view I am not taking into account the nodes or interfaces. I am just looking for a real time overall view if a site is up or down.
Sites
|
Unit Monitor / Up or Down
Where do we start?
First I want to focus on the site discoveries and the monitors to tell me if a site is up or down. After initially implementing this I had a requirement from the trolls that they didn't care if certain sites were down outside of certain business hours because of various reasons. This required me to do some break dance moves and build in blackout time periods that would suppress alerting during these periods but retain the state of down sites as it entered into the blackout window.First let's look at my class definition for the Site.
I have a discovery that runs every 10 minutes looking for new or removed sites from the SolarWinds Database:
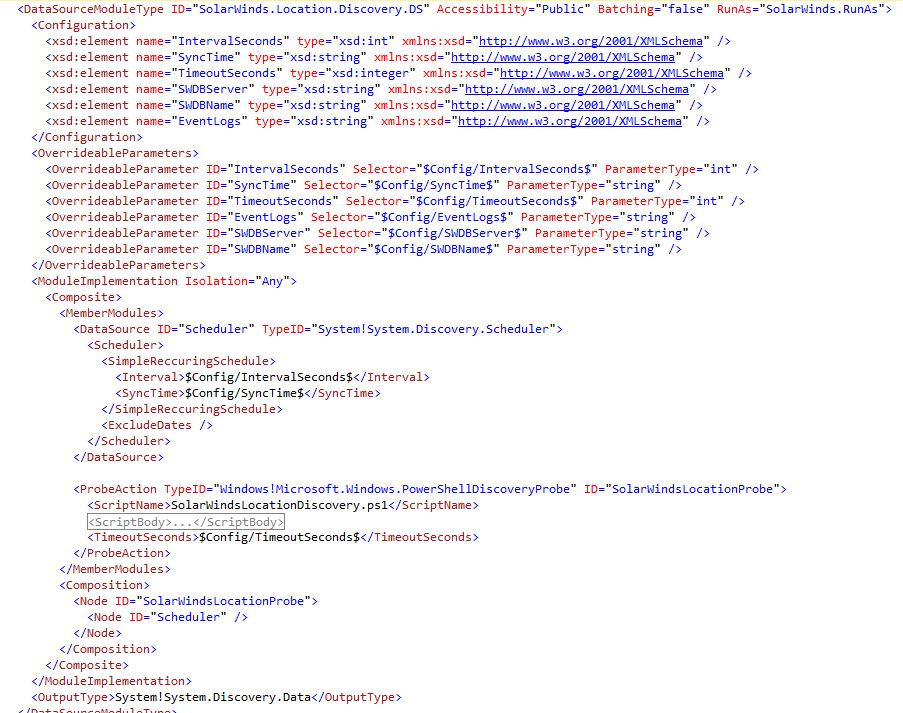
It uses a data source that has a PowerShell script that goes and gets that data from the SolarWinds database:
The PowerShell Action Probe does the query to the database and sets up the discoveries for SCOM:
You can ignore the discoveries for 'SolarWinds.Location' for now.. That is the class used for the interface and node rollup.
Now you have all of your sites in SCOM and then we need to add a monitor to the sites to see what the status of these are according to SolarWinds.
The unit monitor allows you to set the SolarWinds database server and instance name as well as the SCOM server and instance name which will be used in the state queries.
The unit monitor type is the go between the unit monitor and the datasource doing matching and state checks.
The data source is going to query the SolarWinds database to see the status of the site. Note that there is a blackout window that is checked in the code and the rules of engagement are:
1. Sites can't NEWLY alert during the blackout period
2. Sites will remain in alert state during the blackout period if they were previously alerting prior to the blackout period.
3. If a site goes down during the blackout period and was previously healthy, it remains healthy until the blackout period ends.
4. If a site was down before the blackout period and goes back to healthy during the blackout period, it will change state to healthy, but can't alert again until the end of the blackout period.
Let's take a look at that code:
This is a scratch of the surface of what is being created... In future blog posts I will start working into the interface/node/site relationships and monitors. The entire management pack as it exists today is available for free.
XML Pack <- Download
XML Pack <- Download


